Description
Data Collection
Dream Report software incorporates a Eurotherm Review driver and report template enabling historical data to be obtained from devices such as 6000 Series graphical recorder, T2550 Programmable Automation Controller and Eycon TM Visual Supervisor. Data can be collected either automatically over an Ethernet network or manually with removable media.
A robust communications kernel is installed enabling the collection of data and alarms from multiple real-time and historical sources – utilizing OPC, OLE and ODBC standards to ensure a common interface between sources from different suppliers.
Report Generation
In automatic mode, report generation and distribution can be triggered by an event or advanced scheduling. In manual mode, an additional application (Dynamic Report GeneratorTM – DRG) provides for adjustment of the report schedules or the generation of a demand report at any time.
Data Logging
Dream Report software, with its powerful historian, logs by groups, data and alarms from:
- OPC servers.
- Other connected realtime sources – ODBC, OLE etc.
- Analytical information as defined in reports.
With unlimited groups set up with specific logging conditions for each group, clean and accurate data is obtained and logged by default on MSDE from SQL Server. Other open databases such as Oracle, MySql, Access or Eurotherm Information Manager can also be utilized.
Objects
- Text representation: Enables the extraction and display analysis from historian databases such as a Review database.
- Tables: Multiple options to extract data and alarms into different tables. Users can select pre-formatted tables or create their own with the SQL table.
- Bars and pies: Bar graphs and pie charts to display various statistical values and alarms with advanced visualization views (%, legend, values etc).
- Charts: Users can define time based XY charts. They can combine charts from different time frames to visualize and compare results quickly. Moreover, the chart object supports different types of data – value, average value, linear regression. Users can display and adjust multiple scales automatically or manually.
Documentation
Eurotherm Product Selection Guide (HA029395USA Issue 8)![]()
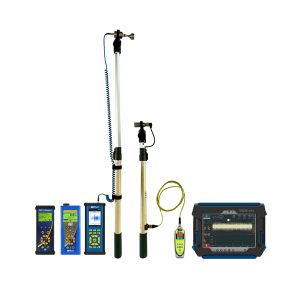
I&E Data Collection Extension Poles
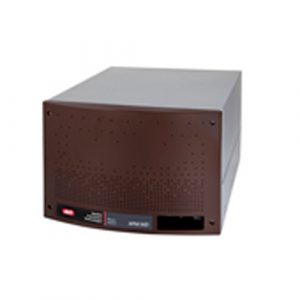
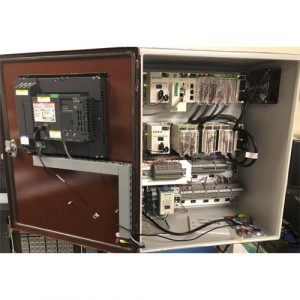
RPM MD Lab or Rackmount
RPM® 785
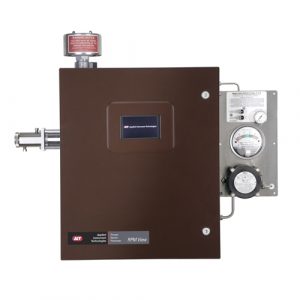
RPM View
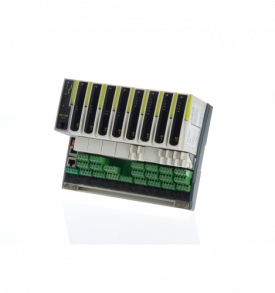
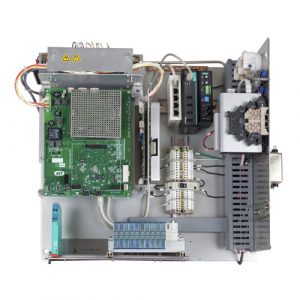
ACA.HF Controller
ACA.HF
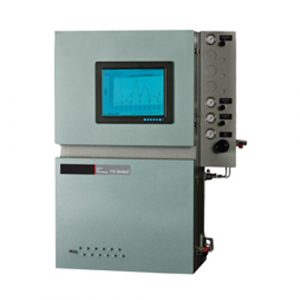
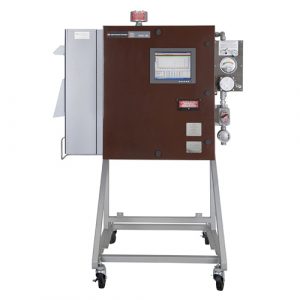
FXI® Series5
ChromFX
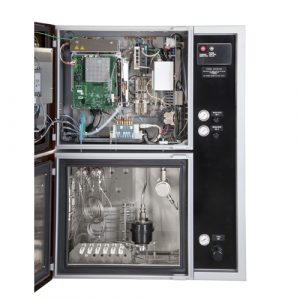
FXI Series7
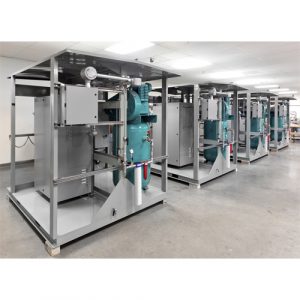
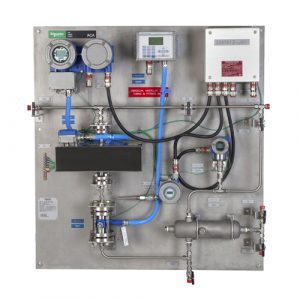
FXI Sample Conditioning System
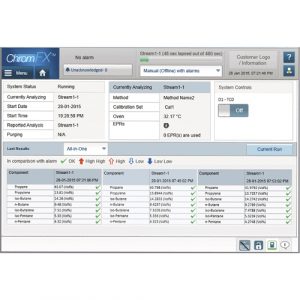
THE LATEST FXI SERIES S/W RELEASE